More
Сhoose
United Kingdom

Charter Avenue, Coventry
+44 737 7259 354

  • Date: January 2026
  • Author: Wajahat Hussain

Overview:

This Power BI dashboard was developed to provide a centralized performance monitoring system for Adidas sales across the United States. The dashboard tracks key KPIs including:

  • Total Revenue: $899.90M

  • Units Sold:48M

  • Total Profit: $332.13M

  • Average Profit: $34.43K

It integrates sales data across regions, retailers, sales methods (In-store, Online, Outlet), and time (monthly & quarterly). Interactive slicers for Date, Region, and Retailer allow dynamic filtering and drill-down analysis.

Problem:

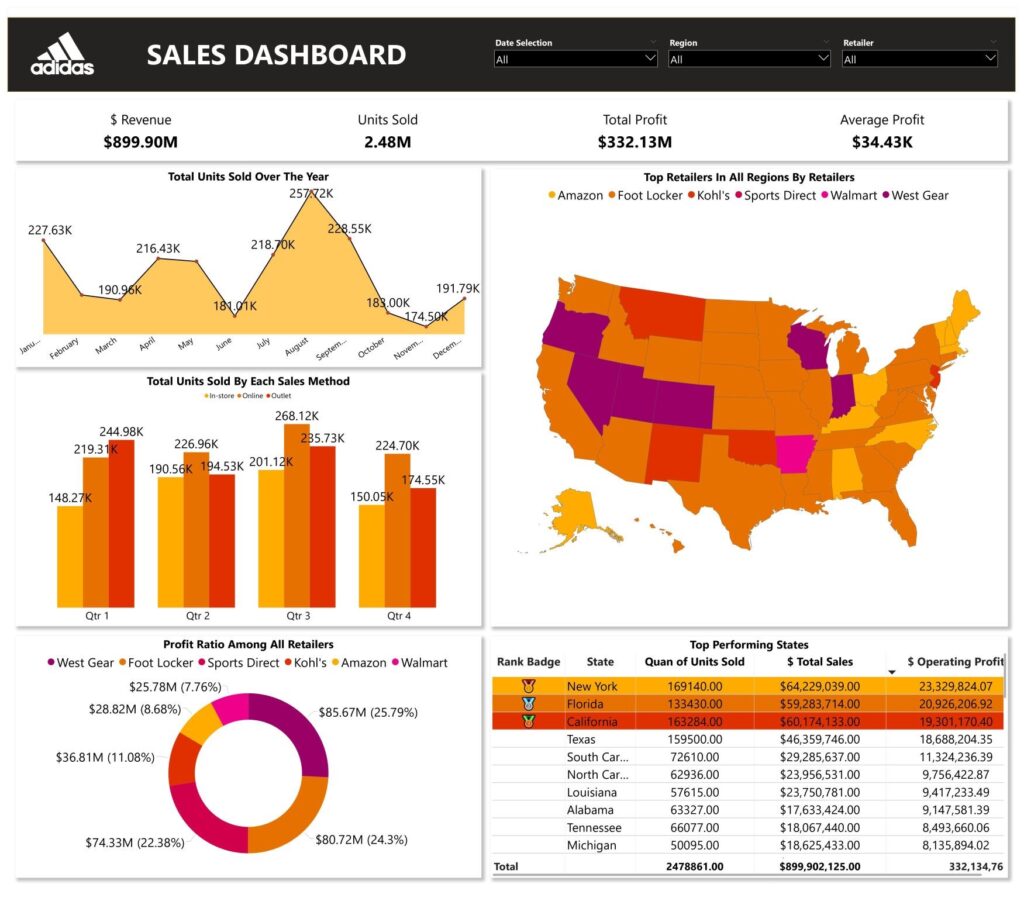
Adidas required a unified reporting solution to:

  • Monitor revenue and profitability across states
  • Identify top-performing retailers
  • Analyze seasonal sales trends
  • Compare sales channels performance
  • Detect high-revenue but low-profit segments

Without this dashboard, decision-making would rely on static reports, making it difficult to quickly identify performance gaps and growth opportunities.

Key Insights


Strong Overall Profitability:


With $332M profit on $899M revenue, the business shows a strong profit margin (~36–37%), indicating healthy operational efficiency.


Seasonal Sales Pattern:


From the “Total Units Sold Over the Year” chart:

  • Sales peak in August (257K units)
  • Noticeable dip around June and November

Insight: Back-to-school or seasonal demand likely drives Q3 growth. Marketing and inventory should be scaled before peak months.


Sales Channel Performance:


From quarterly sales method comparison:

  • Online sales consistently outperform In-store and Outlet

  • Q3 shows the highest performance across all channels

 Insight: Digital sales channels are a major growth driver → Adidas should prioritize e-commerce investment and digital marketing.


Retailer Contribution Analysis:


From the profit ratio donut chart:

  • West Gear (25.79%) and Foot Locker (24.3%) contribute the highest share of profit.

  • Amazon and Walmart contribute smaller shares comparatively.

Insight: Strategic partnerships with top retailers are critical. Negotiation strategies and exclusive product launches with top contributors could increase revenue further.


Top Performing States:


From the ranking table:

New York – Highest Sales & Operating Profit

Florida
California


Insight:

  • Revenue concentration in a few states suggests strong brand dominance there.

Opportunity exists to expand aggressively in mid-performing states like Texas, North Carolina, etc.


Geographic Retailer Dominance:


The map visual shows retailer dominance varying by state.


Insight:
 Different retailers perform better in different regions → region-specific marketing & distribution strategies should be implemented instead of a uniform national strategy.

Business Growth Impact

This dashboard enables:
  • Data-driven regional expansion


  • Optimized inventory allocation before peak months


  • Channel strategy shift toward online growth.


  •  Stronger retailer negotiation based on profit contribution


  • Identification of underperforming states for targeted marketing
Looking to make your mark? We'll help you turn
your project into a success story.

Ready to bring your ideas to life?
We're here to help